Configuring Charts on the Timesheet
- Deniz Oğuz
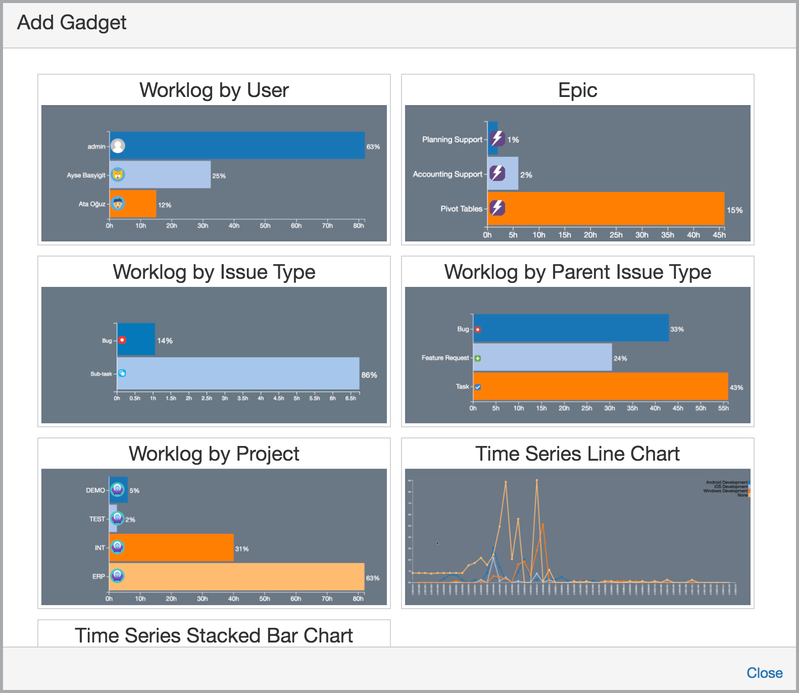
You can add any number of charts to timesheet/worklog report pages. After the timesheet is displayed press the "Manage Gadgets" button on the bottom right corner of timesheet. This will toggle chart layout editing on or off. When editing is turned on, you will see it contains two rows. First row displays charts at page width and the second row displays charts in 2 columns, each one as half size of the page.
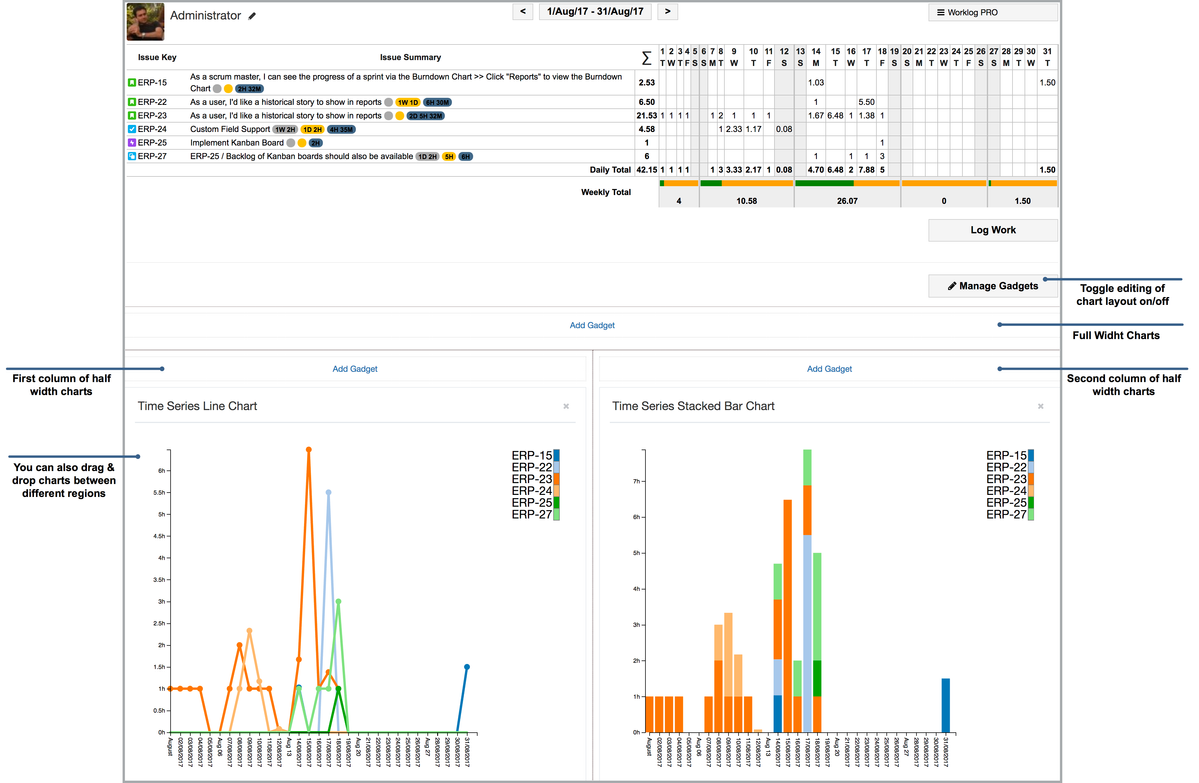
To add a new chart click on "Add Gadget" link in the corresponding column and click on the chart you want to add. All WorklogPRO charts available in normal JIRA dashboard are also available in timesheet page. You can also drag & drop charts between different columns and the chart will resize accordingly. To remove a chart click on the 'x' on the top right hand side of the chart. If you add a new work log to timesheet or if you change an existing work log chart will be updated automatically.