Time Series Charts
- Deniz Oğuz
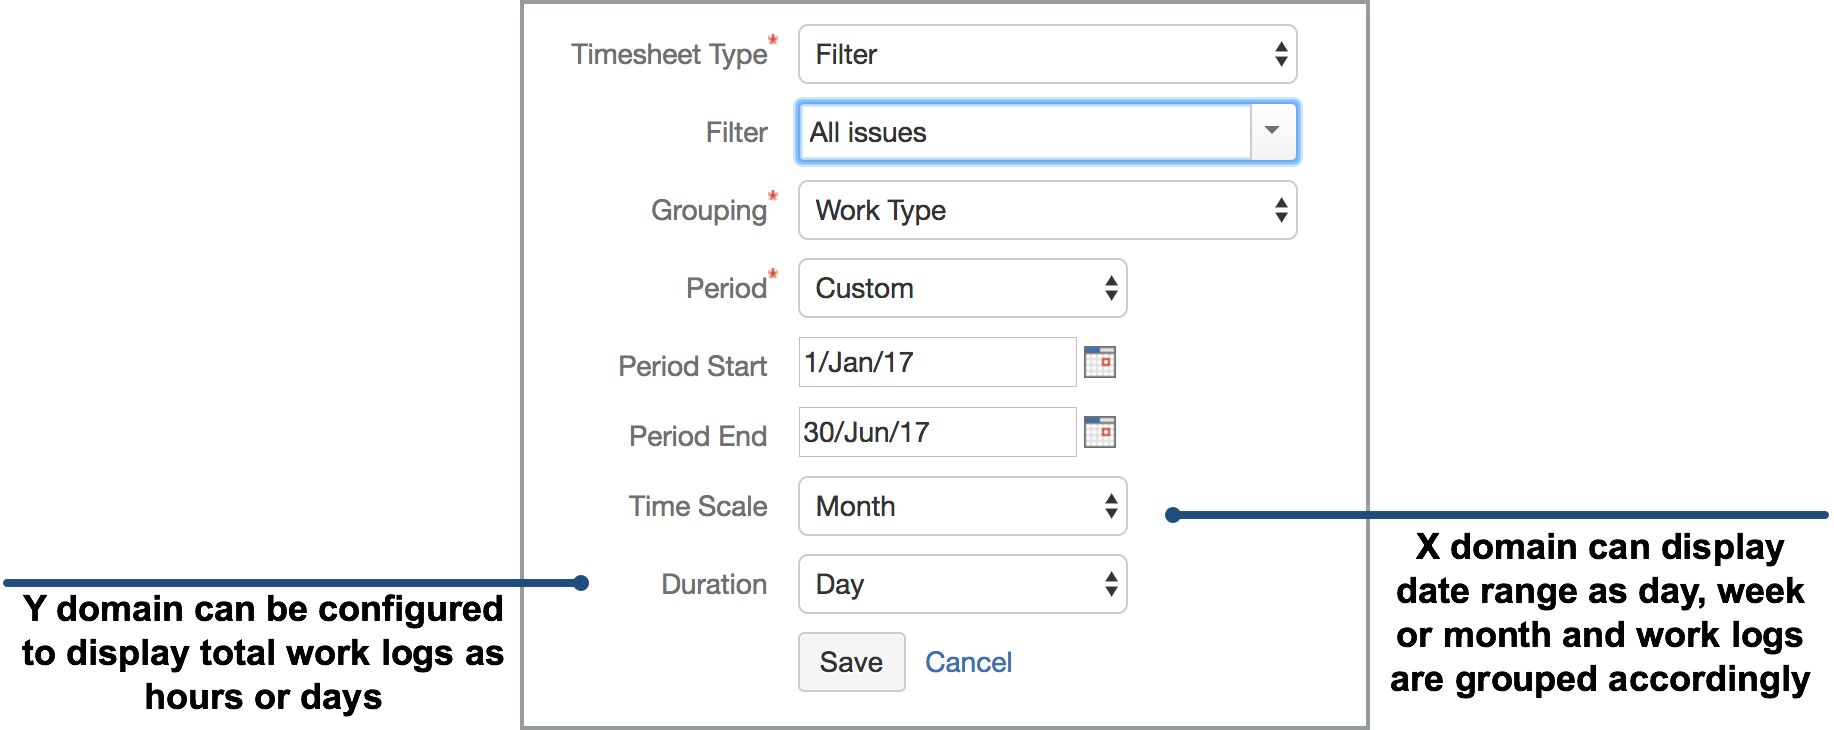
These charts are more complex and more configurable than simple "Bar Charts". These charts plots work log total on the 'y' axis, and time on the 'x' axis. Configuration is very similar to 'Custom Timesheet' but since this is a chart other than 'Time Scale' and 'Duration' attributes. 'X' Axis displays time range selected by adjusting "Period Start" and "Period End" fields. Ticks in the X scale can be configured to display every day, week or month. Work logs are also grouped according to selected time scale.
Time Scale: Can be Day, Week or Month. If you select day, every day has a tick in the X axis, if you select week, only week starts are displayed in the X axis and all work logs that belong to the same week are grouped in that week. Similar grouping is also applied if you select month.
Duration: Work log totals can be displayed as hours or days depending on your choice.
Time series charts are added in 2.20.0 version of WorklogPRO and currently following charts are available: