Checking Browser's Logs
Browser's error log is one of the most useful tool for understanding why something is not working. It shows error messages and network requests and responses. We can understand whether the browser is sending correct request and receiving correct response. You can open browser's developer tools window using F12 key in most browsers, or if you are using Safari you can open it with CMD+OPTION+C key combination.
When you open Browser's developer tools window has lots of tabs such as "Elements", "Console", "Network" etc. The ones we need to check are "Console" and "Network" tabs.
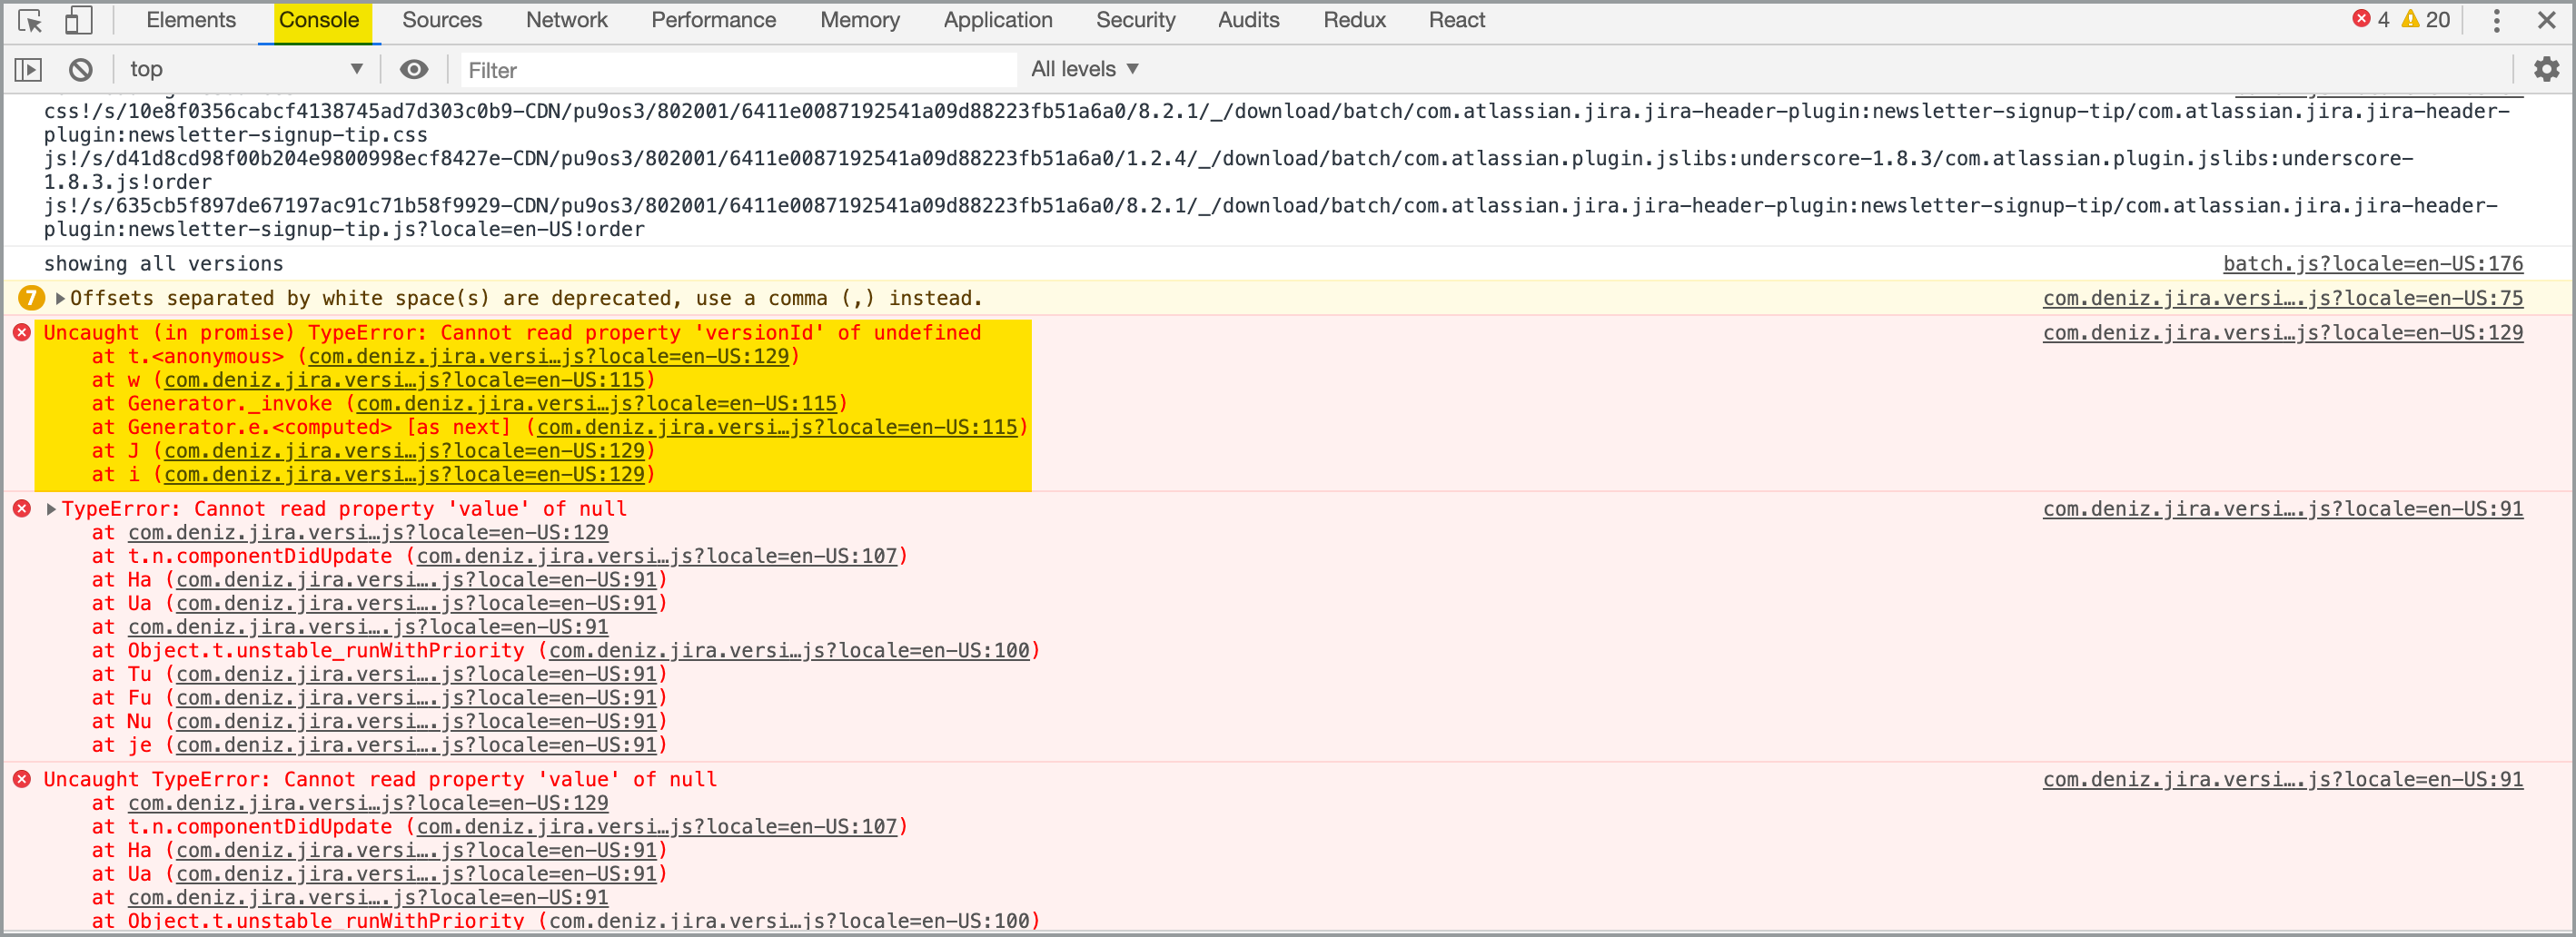
Please first check "Console Tab" for error messages. There should be a lot of text in "Console Tab" but check for any red texts which are error messages. In below example there are several error messages caused by buggy JavaScript.
If you click on the first line (com.deniz.jira.versi...js?locale=en-US:129) on above screen it will show related line of the source file in the "Source Tab" of the browser. Problematic source code will be shown with red underline but it may not correctly scroll to beginning of the error. You may need to scroll left until you see the beginning of red line. Please check following screenshot for an example
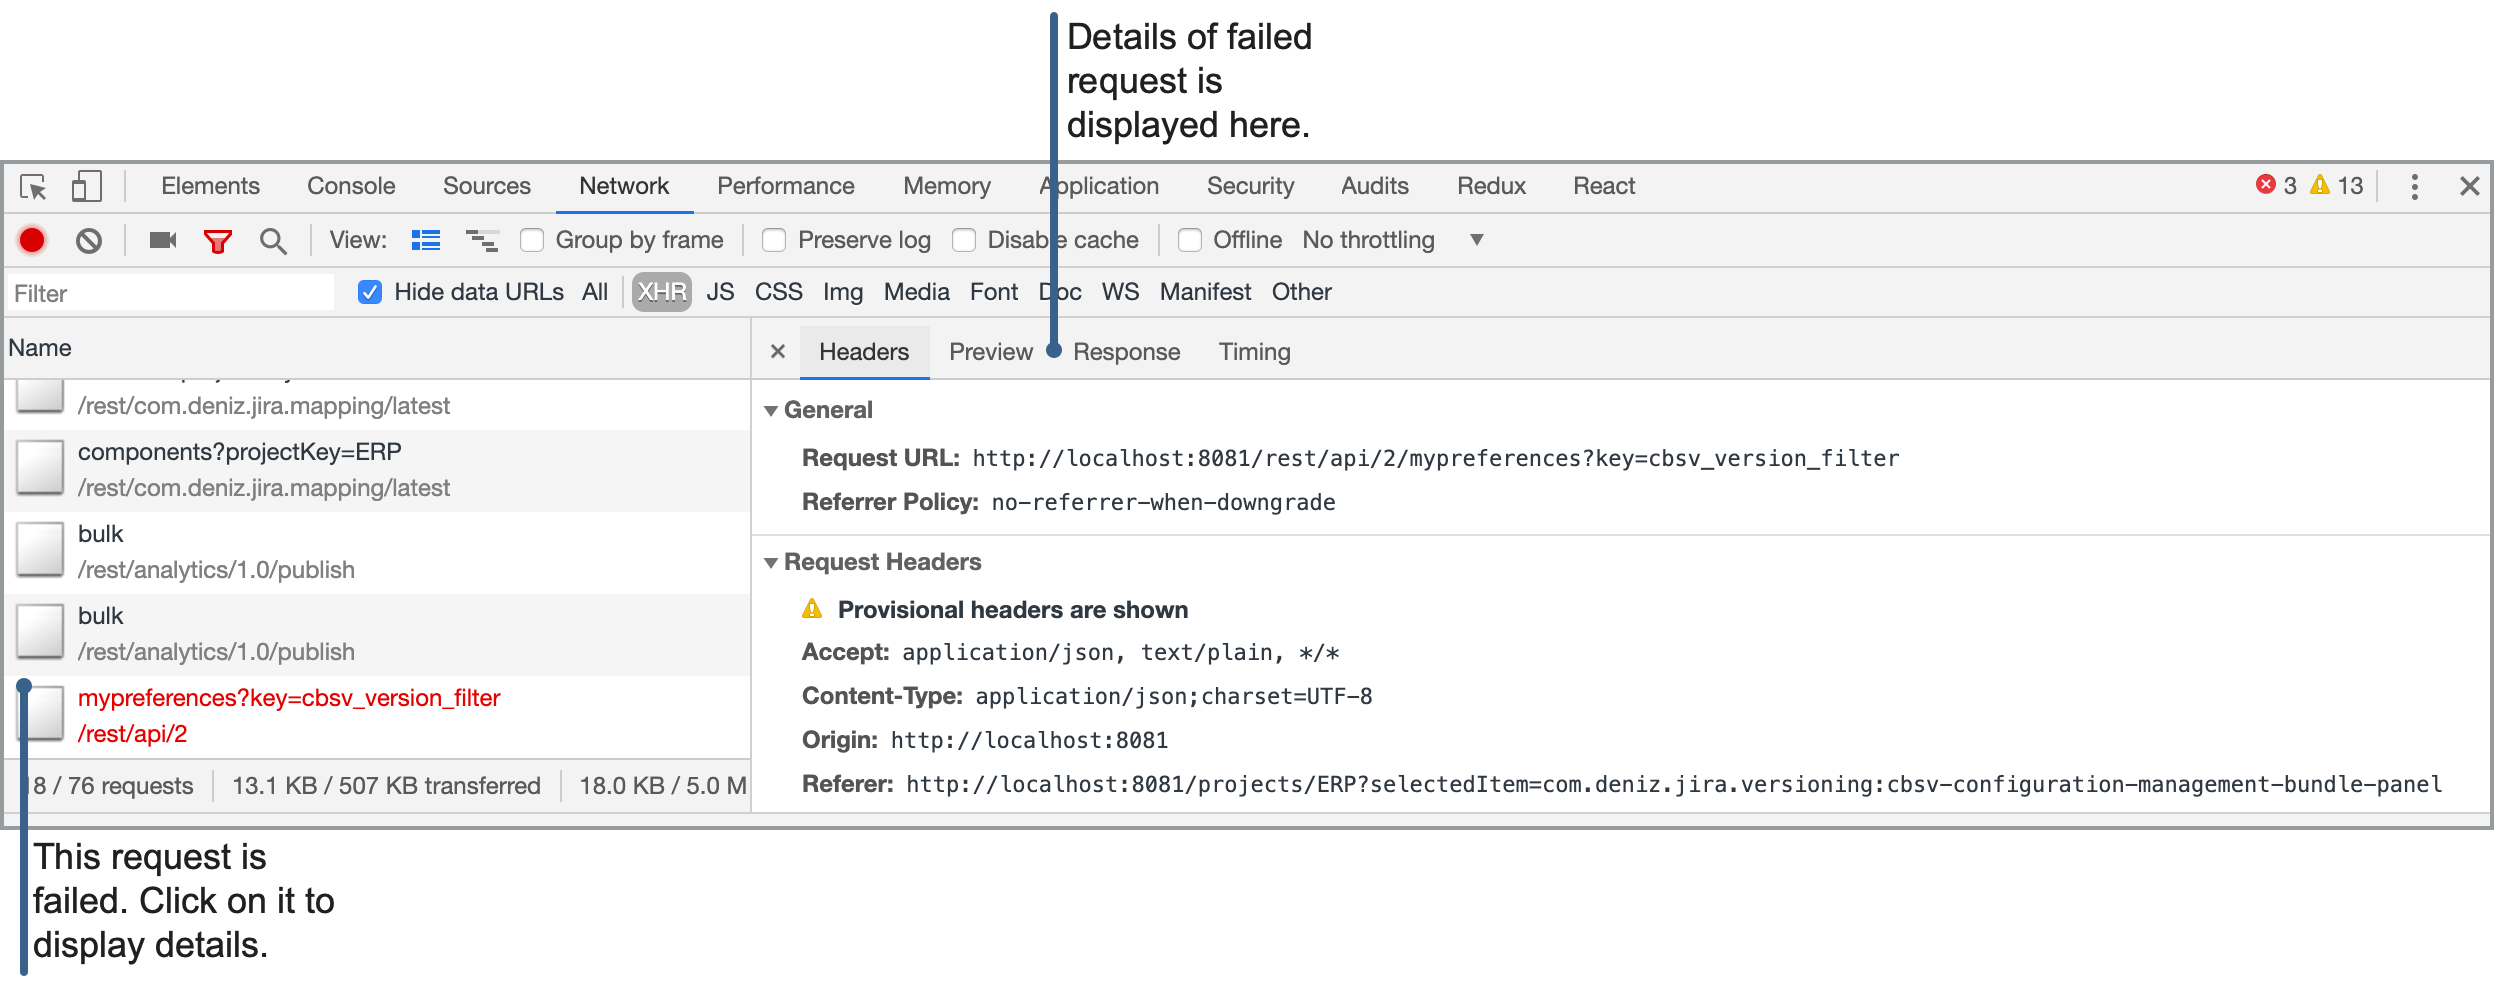
The last tab we need to check is "Network Tab". Click on "Network" label to see network requests. Please make a quick check to see whether there are any failed requests or not. Failed requests are shown with red text. If there is failed requests please check "Headers", and "Response" tabs. If requested please send a screenshot of headers and responses.


