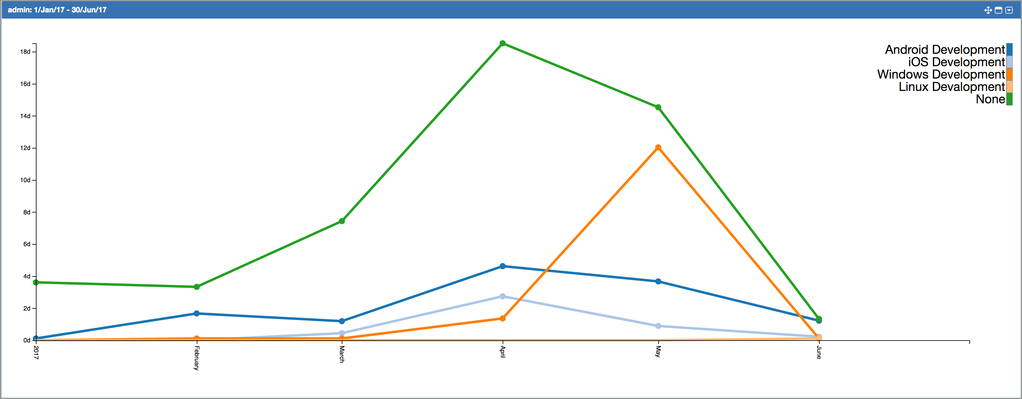
Configuration of this chart is very similar to configuration of timesheet. Since a chart need configuration for x and y scales, it also contains extra configuration options. X Scale displays time range selected by adjusting "Period Start" and "Period End" fields. Ticks in the X scale can be configured to display every day, week or month. Work logs are also grouped according to selected time scale.
Following example chart is showing all work logs entered by admin user between 01 January 2017 and 30 January 2017. Work logs are grouped by "Work Type" work log attribute, so this chart is showing how effort of admin user is divided by "Work Type"

