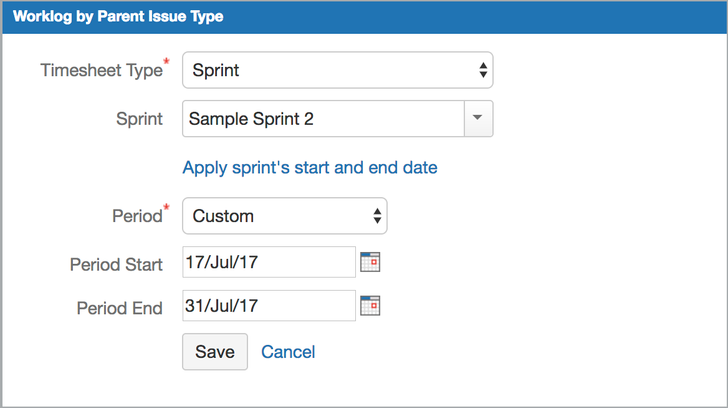
All of these charts has the following same configuration screen and very similar to "Custom Timesheet" configuration as shown in the following screenshot.
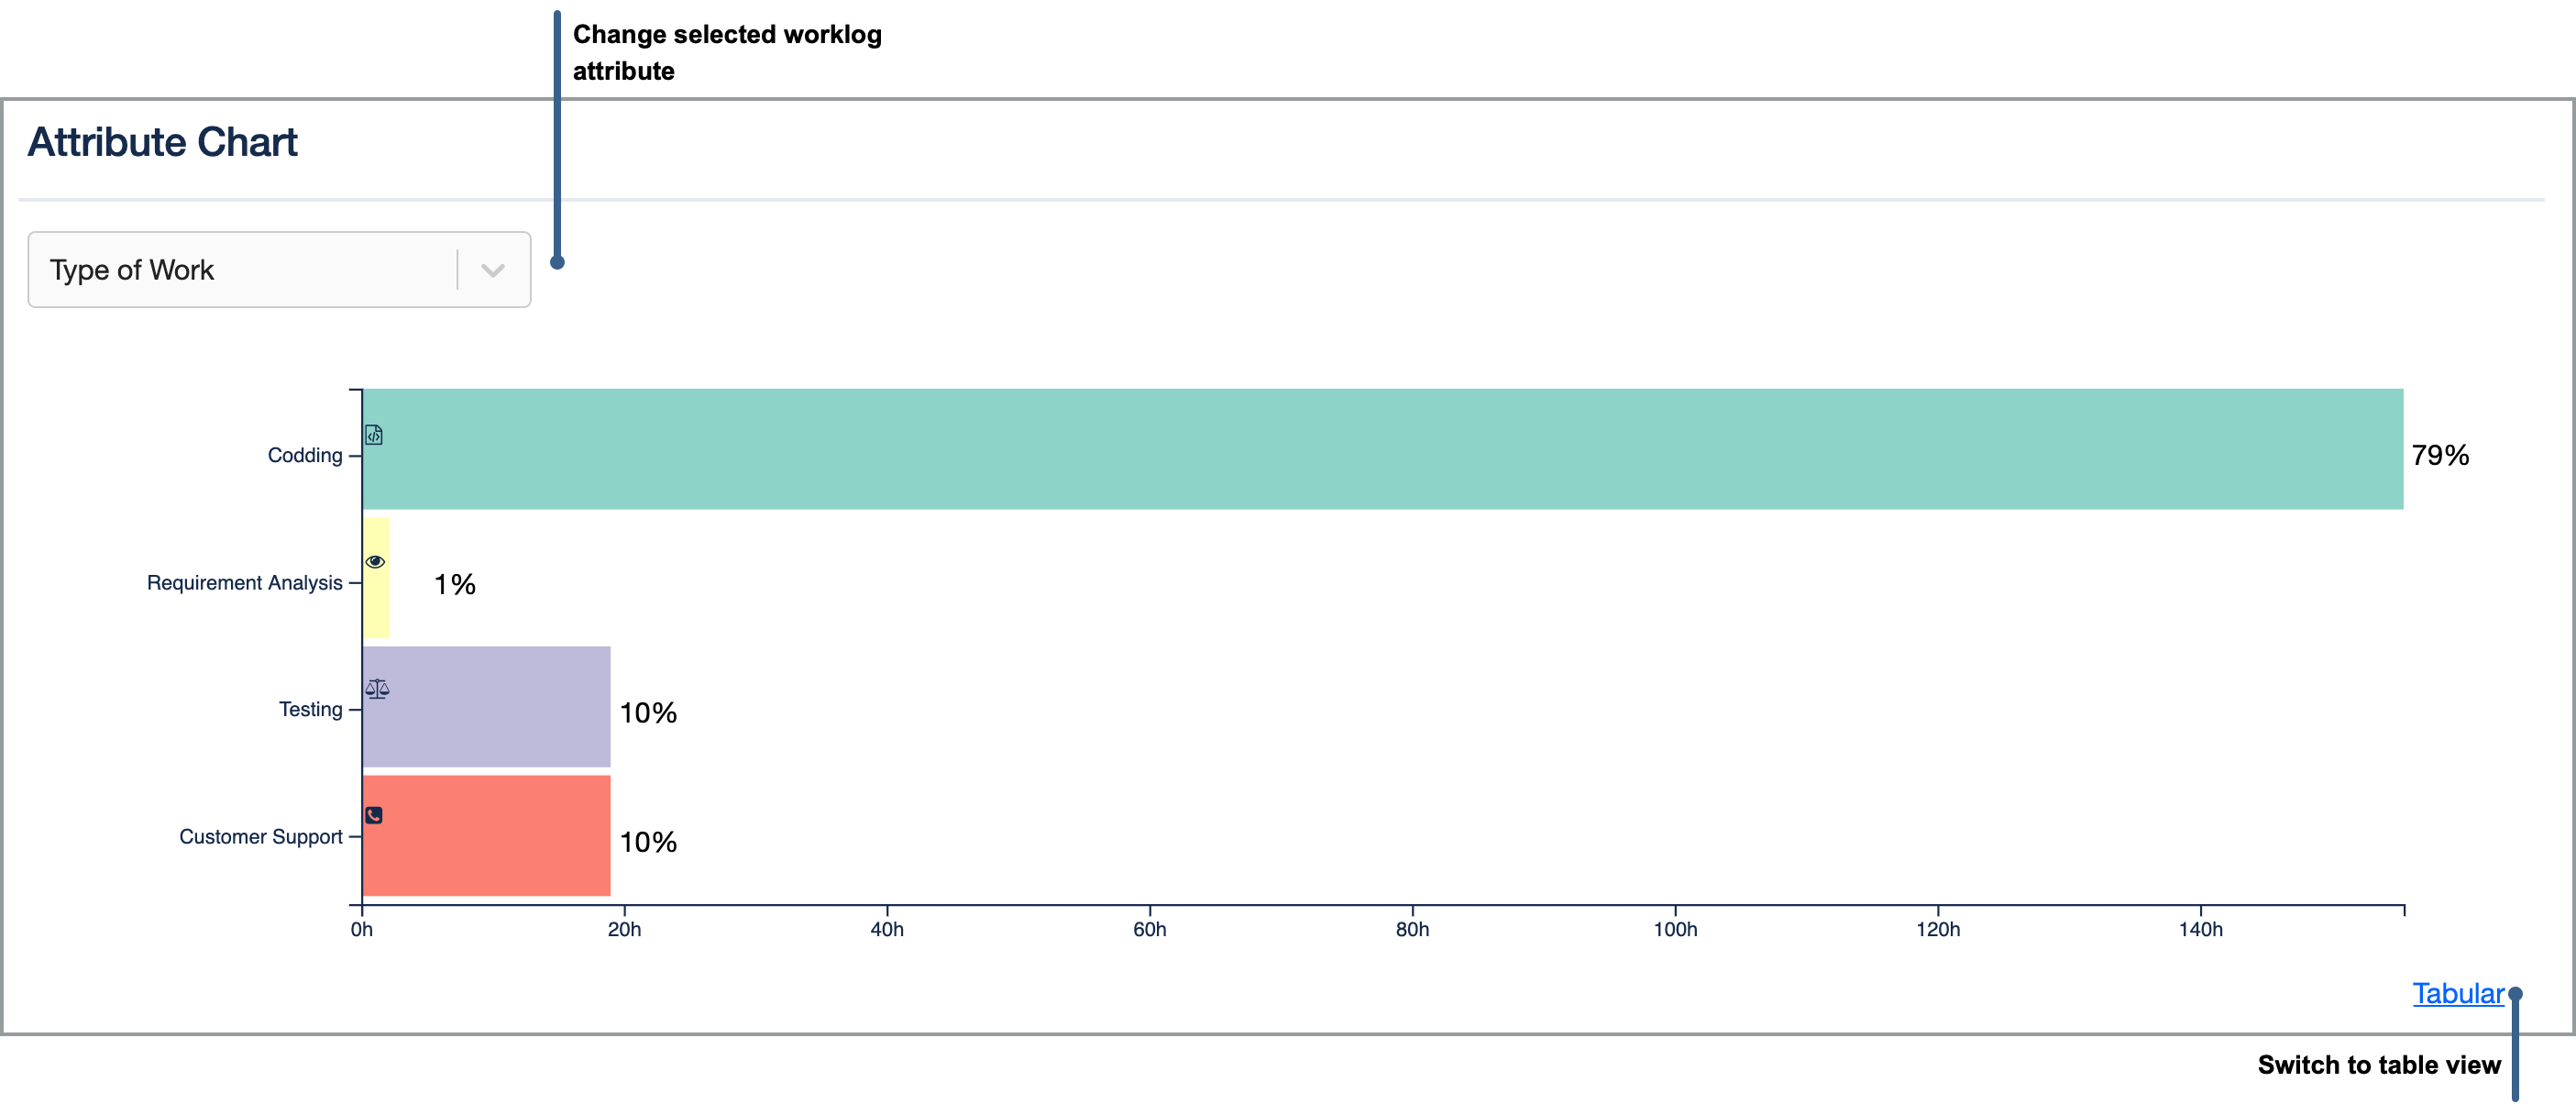
For all charts, you can switch to tabular display mode and display the data feeding the chart in tabular format by clicking on "Tabular" link at the bottom right of a chart.
| Anchor | ||||
|---|---|---|---|---|
|
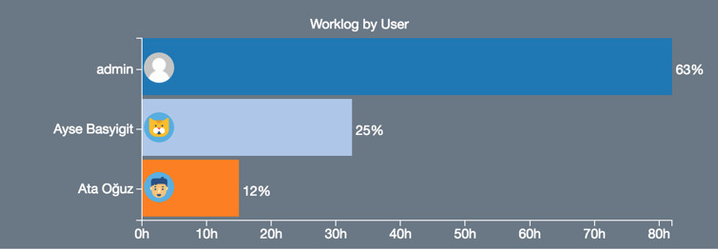
This chart is displayed if grouping of work logs are done by users and shows distribution of total work log effort between users.
| Anchor | ||||
|---|---|---|---|---|
|
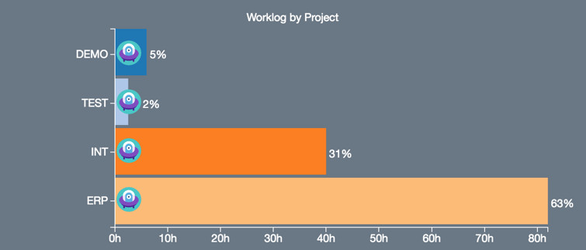
This chart is displayed for timesheets other than project timesheet and shows distribution of total work log effort between projects.
| Anchor | ||||
|---|---|---|---|---|
|
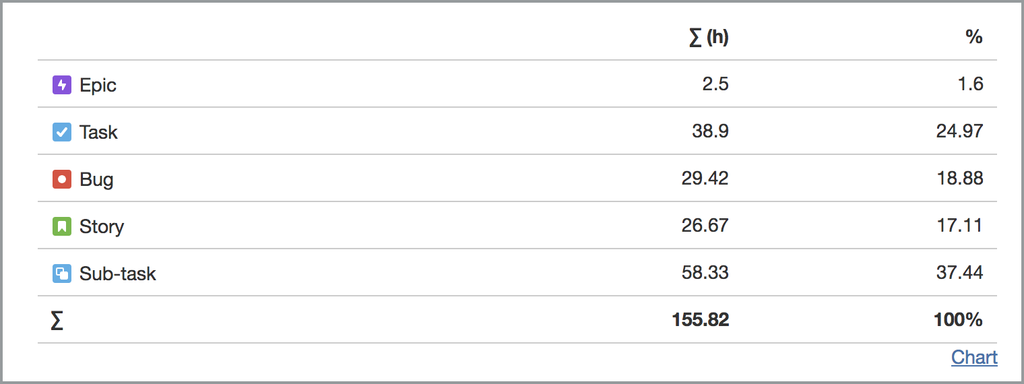
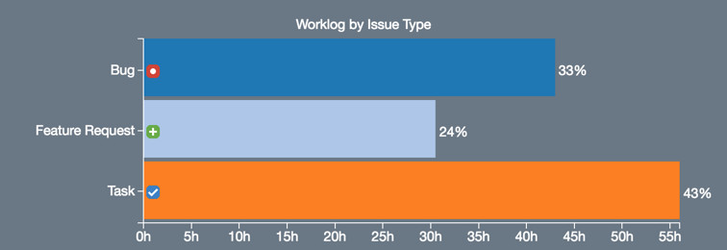
This chart is displayed if grouping of work logs are done by issue. This chart shows distribution of total work log effort between issue types. This chart displays work log total of sub-tasks. If you don't want subtask issue types to be displayed you should use "Work Log by Parent Issue Type" chart.
| Anchor | ||||
|---|---|---|---|---|
|
Shows effort distribution between epics. Work logs registered for sub-tasks of the epic, issues in the epic and sub-tasks of the issues in the epic are all counted in the work log total of an epic.
| Anchor | ||||
|---|---|---|---|---|
|
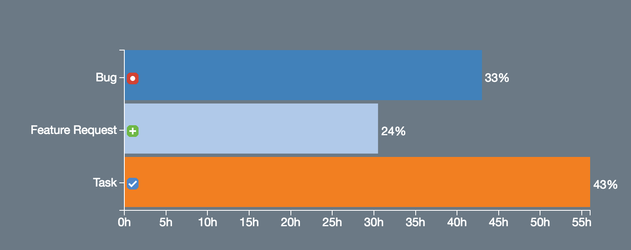
Shows effort distribution between different parent issue types. Efforts registered for sub-tasks are counted in the work log of their corresponding parent issue type.
| Anchor | ||||
|---|---|---|---|---|
|
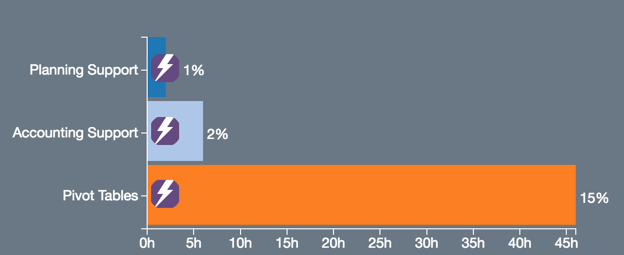
Shows effort distribution between different worklog attribute types.