Performance & Scale Testing - 2019
Data Set
We have used data set provided by Atlassian in their "DC App Performance Test Kit". We needed to update this data set for our own tests. In the standard data set there are 500 projects. We have selected random 100 projects from this set and created extra data on these projects as shown below. In our tests we only used issues from these 100 projects. Note that this is nearly worst case scenario because in practice only some bigger projects will use features of this add-on and for things like view/edit issue, view board etc. this add-on will not exercised. But for our tests the add-on is exercised with every request.
- 2000 additional components (20 components per project)
- 10.000 additional versions (100 versions per project)
- 40.000 component versions (400 component versions per project)
- 80.000 Issues have component version set on them. (800 per project)
- 2.000 Bundles (20 per project)
- 3 Custom fields. 2 calculated (fixed in bundle and affects bundle) and 1 single select (Manual bundle).
- 10.000 Issues have "Manual Bundle" custom field set. 2 Calculated fields have a value potentially for every issue with component versions (80.000).
- ~8000 version hierarchy node (60+ per project)
- We have created 15 subcomponents in each selected project and added 4 real components each (60 item subcomponent tree per project)
- We have also created a subproject hierarchy using 15 virtual projects (folders) and 30 real projects inside each of them, 450 item in the tree.
Test Procedures
We have used "DC App Performance Test Kit" on Amazon AWS for final execution. We have forked the project and made some modifications to tests and data sets. You can access the repository on Github. We have two branches, part1 and part2. We have used the procedures provided by Atlassian.
Test Procedure
We have extended provided JMeter tests. For some of the build in actions our app performs additional Rest API calls to get app configuration. We have added these to following JMeter extension points. We didn't use Selenium because nearly all of our UI is implemented with Javascript making Rest API request and put UI overhead to client browsers and they don't cause a load on the server.
Part 1
We have performed 4 runs, 2 without app and 2 with app. Our test results are consistent and there is no significant overhead introduced by our app when it is not exercised. All differences between executions are normal. Selenium tests should be hitting our api to get app specific settings because it executes REST API calls through a headless Chromium browser. But as can be seen from the results this is not introducing a measurable delay. We can verify this in Part 2, section 1 too.
Workload:
We use default values in dc performance test framework, 200 as concurrency and 54500 for "total actions per hour" as Jmeter parameters.
We have used following cluster configuration to run our tests:
- Jira Nodes: c5.4xlarge instance. CPU Usage was 18% max.
- DB: db.m4.large instance. We run PostgreSQL 9.6 on this. During our tests db usage was less around 10%.
- Test Runner: t2.xlarge instance. By using an instance on AWS cloud to simulate the clients we minimize any nondeterministic behavior due to our network. During tests CPU usage was between 38% to 48%. This shows that our test runner is not a bottleneck.
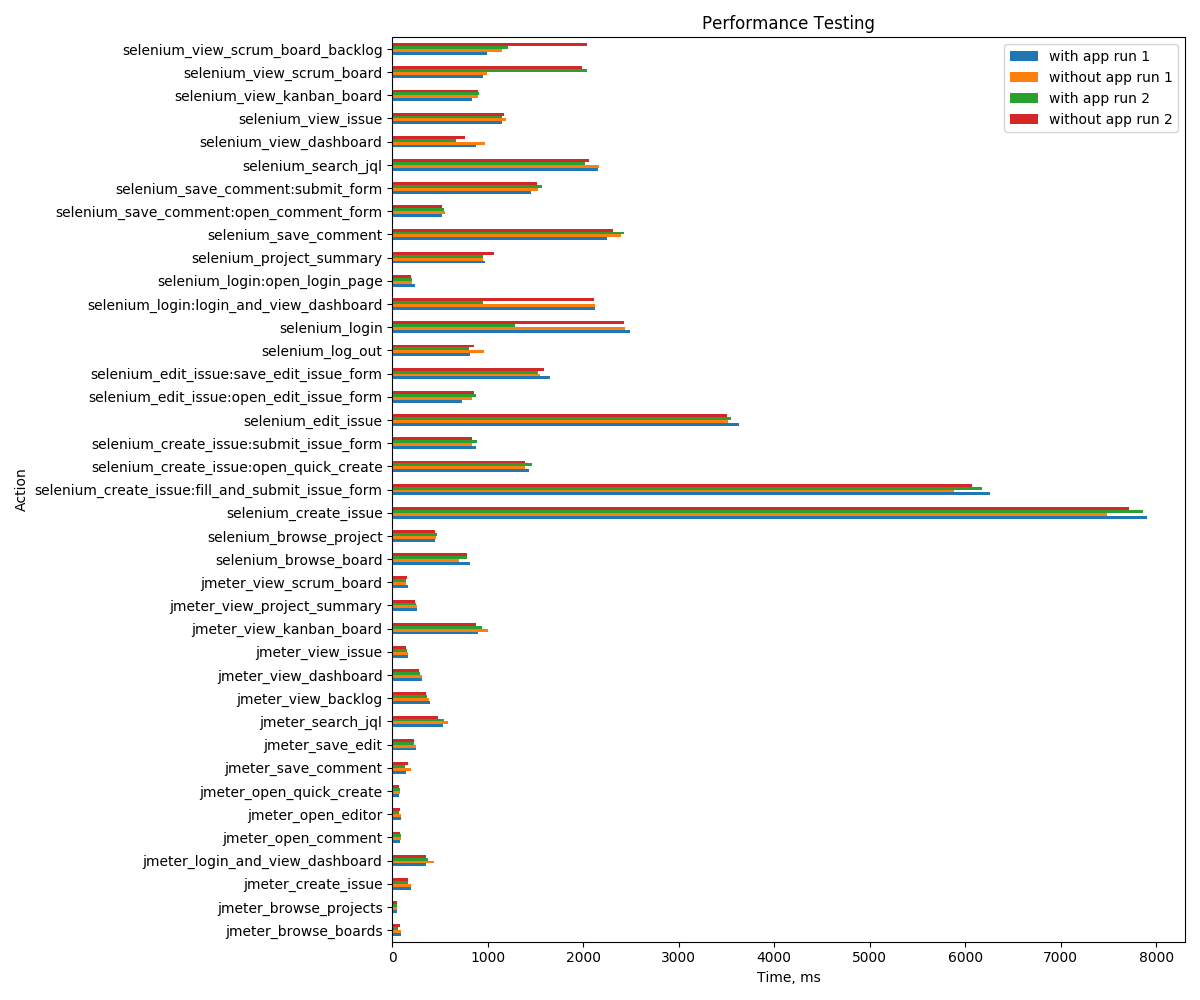
Action | with app run 1 | without app run 1 | with app run 2 | without app run 2 |
|---|---|---|---|---|
jmeter_login_and_view_dashboard | 351 | 442 | 374 | 351 |
jmeter_view_issue | 160 | 163 | 150 | 144 |
jmeter_search_jql | 529 | 579 | 538 | 484 |
jmeter_view_dashboard | 308 | 309 | 293 | 278 |
jmeter_view_backlog | 400 | 386 | 359 | 354 |
jmeter_open_quick_create | 73 | 82 | 76 | 67 |
jmeter_create_issue | 191 | 191 | 161 | 166 |
jmeter_view_project_summary | 256 | 263 | 247 | 234 |
jmeter_open_editor | 93 | 93 | 73 | 80 |
jmeter_save_edit | 249 | 246 | 228 | 224 |
jmeter_browse_projects | 49 | 47 | 47 | 53 |
jmeter_view_kanban_board | 893 | 1007 | 939 | 873 |
jmeter_view_scrum_board | 166 | 144 | 142 | 152 |
jmeter_open_comment | 86 | 88 | 87 | 76 |
jmeter_save_comment | 145 | 197 | 136 | 167 |
jmeter_browse_boards | 88 | 91 | 61 | 83 |
selenium_login:open_login_page | 238 | 209 | 207 | 196 |
selenium_login:login_and_view_dashboard | 2122 | 2120 | 953 | 2109 |
selenium_login | 2492 | 2434 | 1288 | 2426 |
selenium_browse_project | 452 | 462 | 473 | 451 |
selenium_browse_board | 813 | 699 | 782 | 784 |
selenium_create_issue:open_quick_create | 1432 | 1390 | 1466 | 1395 |
selenium_create_issue:submit_issue_form | 880 | 832 | 885 | 835 |
selenium_create_issue:fill_and_submit_issue_form | 6259 | 5881 | 6179 | 6071 |
selenium_create_issue | 7906 | 7488 | 7859 | 7718 |
selenium_edit_issue:open_edit_issue_form | 734 | 838 | 874 | 861 |
selenium_edit_issue:save_edit_issue_form | 1649 | 1547 | 1529 | 1593 |
selenium_edit_issue | 3636 | 3512 | 3550 | 3505 |
selenium_save_comment:open_comment_form | 518 | 555 | 543 | 517 |
selenium_save_comment:submit_form | 1449 | 1530 | 1563 | 1519 |
selenium_save_comment | 2247 | 2398 | 2424 | 2309 |
selenium_search_jql | 2153 | 2163 | 2019 | 2062 |
selenium_view_scrum_board_backlog | 993 | 1144 | 1209 | 2044 |
selenium_view_scrum_board | 949 | 989 | 2035 | 1988 |
selenium_view_kanban_board | 830 | 895 | 911 | 896 |
selenium_view_dashboard | 874 | 967 | 667 | 765 |
selenium_view_issue | 1148 | 1191 | 1152 | 1169 |
selenium_project_summary | 975 | 953 | 947 | 1070 |
selenium_log_out | 812 | 957 | 803 | 853 |
Part 2
Section 1:
The app loads it's configuration on the following pages so we have added Rest API request for loading the app configuration to extensions.jmx file for the following entry points.
- View Project Summary
- View Issue
- Edit Issue
- View Boards & Backlogs
The app also tries to load "component versions" on following entry points in addition to configuration. So we have added extra Rest API calls for below entry points. "Component Versions" is always loaded. When creating or editing an issue, the user may try to use "subcomponent picker" to update "Component/s" field. We assume that user will try to edit "Component/s" field with 10% of the time so with also load subcomponent tree of the project with 10% probability. When creating an issue, the user may try to use "subproject picker" to select "Project" in addition to "component picker". We assume that user will update "Project" on create issue picker with 20% of the time.
- View Issue
- Create Issue
- Edit Issue
Workload:
We use default values in dc performance test framework, 200 as concurrency and 54500 for "total actions per hour" as Jmeter parameters.
We have used following cluster configuration to run our tests:
- Jira Nodes: c5.2xlarge instance (34 ECU). If we use the same m4.large instance (6.5 ECU) we used in part2, a lot of requests fails due to timeout.
- DB: db.m4.large instance. We run PostgreSQL 9.6 on this. During our tests db usage was less than 15%.
- Test Runner: t2.xlarge instance. By using an instance on AWS cloud to simulate the clients we minimize any nondeterministic behavior due to our network. During tests CPU usage was around 50%. This is mostly caused by selenium. We don't observe any significant cpu usage in section 2 when we only use JMeter.
You can find results for 1 node, 2 nodes, 3 nodes and 4 nodes execution of scalability tests. As can be seen there is no much difference between execution times on each run because even for 1 node configuration system is not overloaded. Our add-on specific requests starts with "conf_man_" prefix and they have very low numbers.
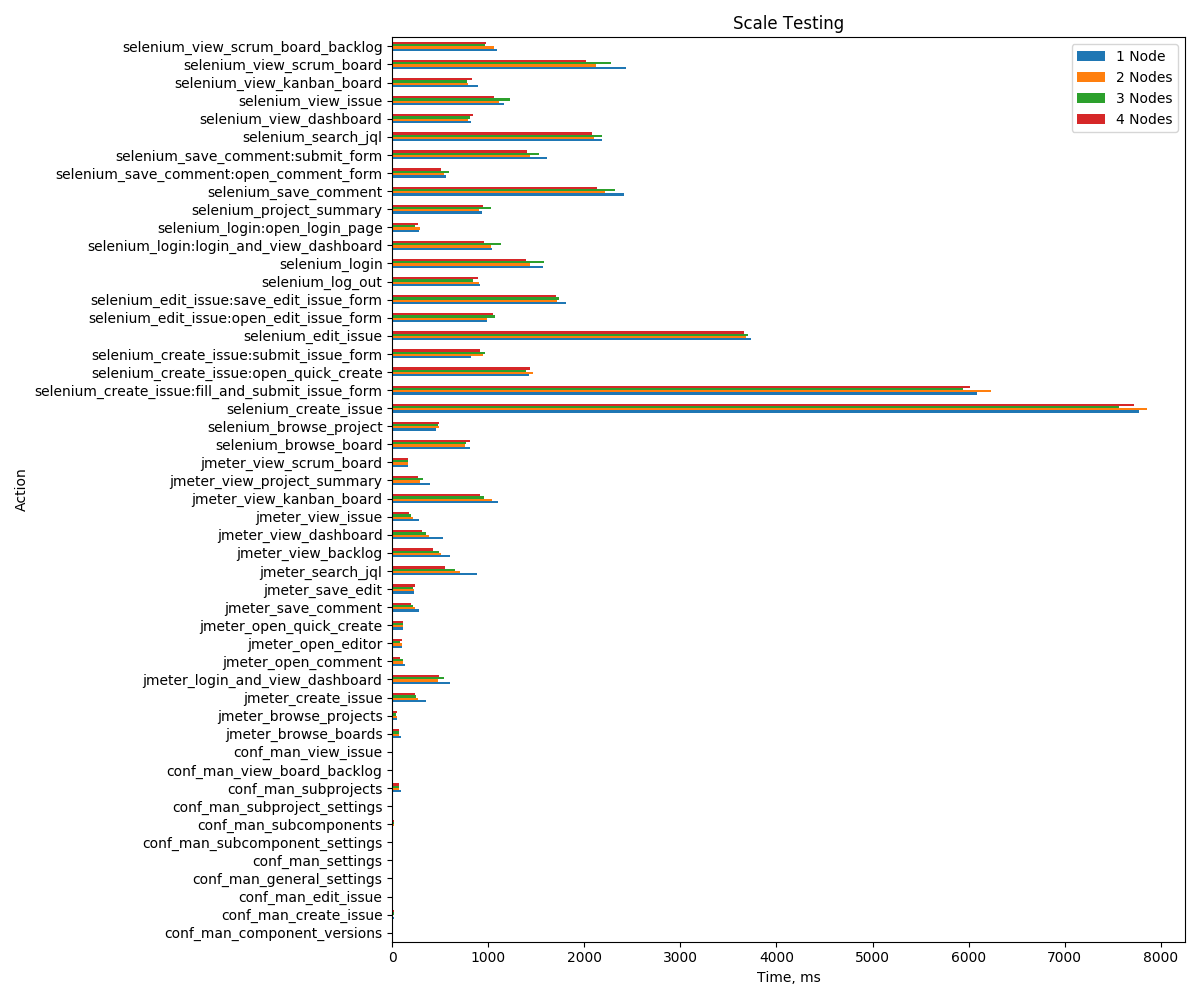
Action | 1 Node | 2 Nodes | 3 Nodes | 4 Nodes |
|---|---|---|---|---|
jmeter_login_and_view_dashboard | 600 | 479 | 538 | 491 |
jmeter_view_issue | 282 | 214 | 193 | 176 |
conf_man_general_settings | 4 | 4 | 4 | 4 |
conf_man_subcomponent_settings | 3 | 3 | 3 | 3 |
conf_man_subproject_settings | 3 | 3 | 3 | 3 |
conf_man_settings | 12 | 10 | 11 | 10 |
conf_man_component_versions | 7 | 6 | 6 | 6 |
conf_man_view_issue | 8 | 7 | 6 | 6 |
jmeter_search_jql | 883 | 701 | 649 | 554 |
jmeter_view_dashboard | 528 | 378 | 352 | 306 |
jmeter_view_backlog | 600 | 504 | 483 | 423 |
conf_man_view_board_backlog | 5 | 5 | 5 | 5 |
jmeter_open_quick_create | 115 | 113 | 112 | 110 |
jmeter_create_issue | 352 | 272 | 242 | 233 |
conf_man_create_issue | 13 | 12 | 16 | 16 |
jmeter_view_project_summary | 393 | 289 | 318 | 271 |
jmeter_open_editor | 102 | 97 | 78 | 98 |
jmeter_save_edit | 230 | 226 | 215 | 236 |
conf_man_edit_issue | 4 | 4 | 4 | 4 |
jmeter_browse_projects | 53 | 47 | 43 | 45 |
jmeter_view_kanban_board | 1103 | 1039 | 954 | 910 |
jmeter_view_scrum_board | 162 | 161 | 160 | 167 |
jmeter_open_comment | 131 | 114 | 109 | 81 |
jmeter_save_comment | 283 | 236 | 217 | 197 |
jmeter_browse_boards | 96 | 71 | 71 | 66 |
conf_man_subcomponents | 10 | 14 | 13 | 15 |
conf_man_subprojects | 93 | 72 | 71 | 68 |
selenium_login:open_login_page | 281 | 286 | 233 | 270 |
selenium_login:login_and_view_dashboard | 1033 | 1024 | 1134 | 960 |
selenium_login | 1564 | 1436 | 1578 | 1395 |
selenium_browse_project | 456 | 483 | 480 | 486 |
selenium_browse_board | 806 | 758 | 766 | 805 |
selenium_create_issue:open_quick_create | 1428 | 1463 | 1389 | 1435 |
selenium_create_issue:submit_issue_form | 820 | 949 | 967 | 916 |
selenium_create_issue:fill_and_submit_issue_form | 6089 | 6235 | 5943 | 6018 |
selenium_create_issue | 7770 | 7860 | 7567 | 7726 |
selenium_edit_issue:open_edit_issue_form | 985 | 986 | 1067 | 1049 |
selenium_edit_issue:save_edit_issue_form | 1806 | 1713 | 1733 | 1706 |
selenium_edit_issue | 3739 | 3683 | 3706 | 3657 |
selenium_save_comment:open_comment_form | 558 | 539 | 590 | 507 |
selenium_save_comment:submit_form | 1609 | 1430 | 1528 | 1398 |
selenium_save_comment | 2413 | 2217 | 2318 | 2130 |
selenium_search_jql | 2180 | 2100 | 2187 | 2082 |
selenium_view_scrum_board_backlog | 1093 | 1061 | 963 | 979 |
selenium_view_scrum_board | 2435 | 2126 | 2277 | 2018 |
selenium_view_kanban_board | 891 | 791 | 780 | 825 |
selenium_view_dashboard | 816 | 784 | 810 | 840 |
selenium_view_issue | 1165 | 1112 | 1223 | 1063 |
selenium_project_summary | 932 | 902 | 1029 | 943 |
selenium_log_out | 909 | 901 | 843 | 891 |
Section 2:
Within this part we test scalability of most important and most used APIs of our app. Our UI is implemented with React and communicates with server side using REST API. We have used JMeter to test Rest APIs provided by the app. We have created our own conf-man.yml file and added each entry point of application. We have following entry points:
- Create Component Versions: Creation of new component specific version. A mapping between component and version.
- Browse Component Versions: Simulates loading of project's "component versions" page.
- Use Component Versions: Retrieval of valid component versions for selected components on issue page
- Create Bundle: Creation of new bundle
- Browse Bundle Loading of project's bundles page.
- Browse Release Notes: Loading of release notes page.
- Search JQL: Various JQLs provided by app
- Browse Subcomponents: Loading of project's subcomponents page.
- Browse Subprojects: Loading of subprojects page.
- Get Subcomponent: Retrieving subcomponents for a project on issue page.
- Get Subproject: Retrieving subproject tree on an issue page.
- Browse Version Hierarchy: Loading of project's version hierarchy page.
Workload:
We use 200 as concurrency and 98000 for "total actions per hour" as Jmeter parameters. Default values for these were 200 and 54500 in performance test framework. We have increased "total actions per hour" variable to such a value that we don't overload database but still can generate enough load. For most of our tests, CPU usage of our database were between 40% to 65%. UI is implemented with React and drawn on user's browsers. Since our UI doesn't generate a load on the server we have only tested our REST API for "Part 2". If we exclude database lookup and some data format transformation there is not much logic on our server side, we have caches to speed up most of these logic too. This is why default value of 54500 "total actions per hour" was too small and also c5.4xlarge instance type was too fast to generate a meaningful measurement. We increased "total actions per hour" and used much slower EC2 instance type for our tests. Also our workload ensures that we only use projects which uses all features of "Configuration Management Toolkit" app. When a test request app specific data such as component specific versions or bundles, there is always some data to report in our test scenario. In a real environment not all projects will use these features.
We have used following cluster configuration to run our tests:
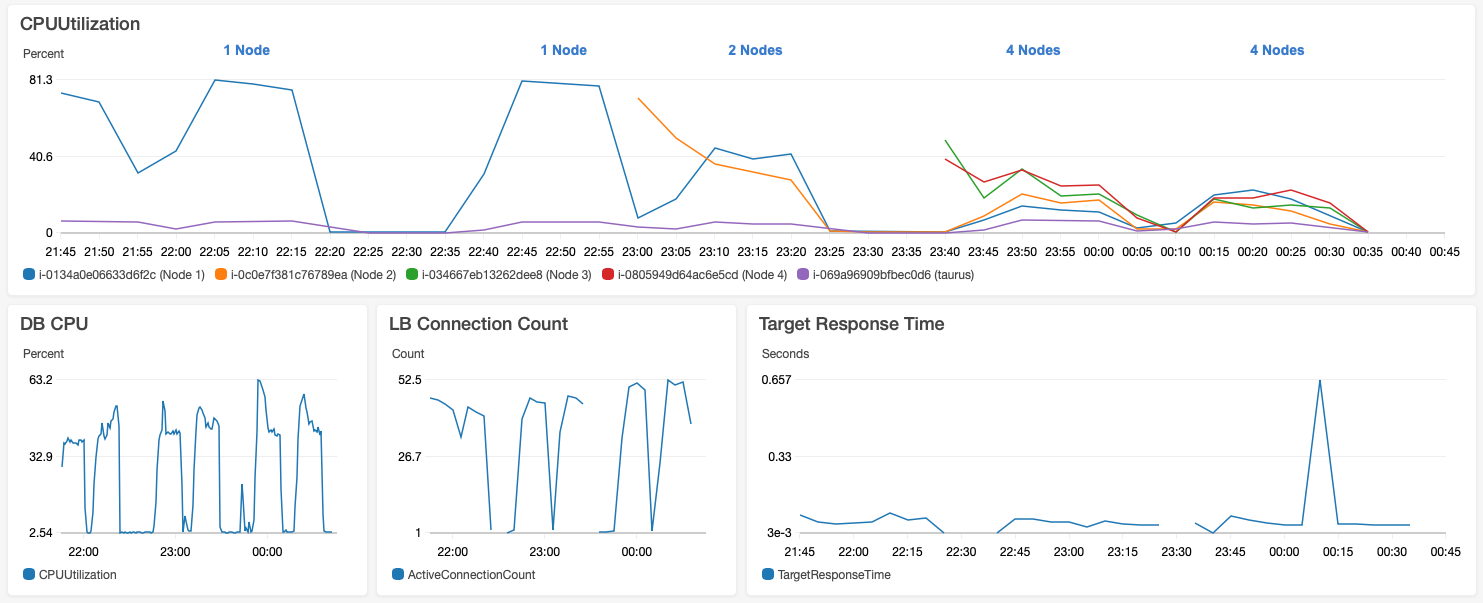
- Jira Nodes: m4.large instance. This is a lot less powerful instance than recommended c5.4xlarge instance recommended in performance test framework. We also use configured -Xmx and -Xms to 5Gbytes instead of 12Gbytes because our instance type has maximum memory of 8Gbytes. We have started with c5.4xlarge instances because this was the default for Atlassian's "AWS Quick Start Template" and recommended by performance test framework. But it was too fast to measure meaningful values, even for 1 node installation Jira nodes cpu usage was around 20%. By using a m4.large instance type and with increased "total actions per hour" we can get 1 node cpu usage close to 100%.
- DB: db.m4.large instance. We run PostgreSQL 9.6 on this. During our tests db usage was between 40% to 65%. For single node test, it was around 45%. For 2 nodes, it was around 50%. For 4 nodes, it was mostly around 50% but it jumped to as high as 63%.
- Test Runner: t2.xlarge instance. By using an instance on AWS cloud to simulate the clients we minimize any nondeterministic behavior due to our network.
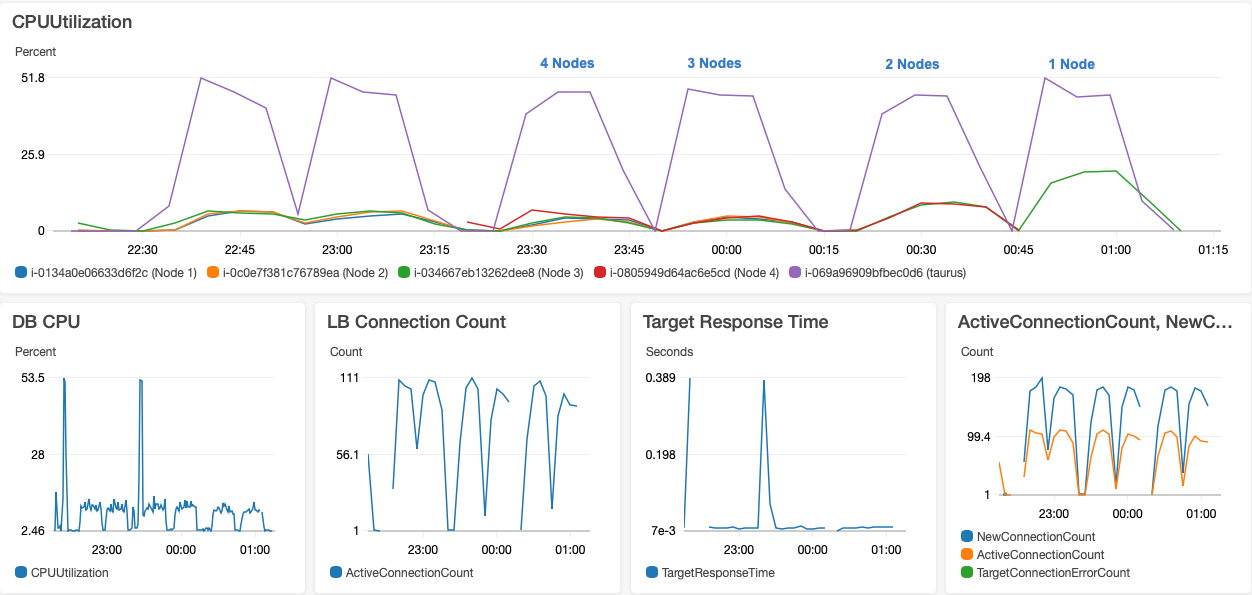
Below graph shows scalability of the app running in 1 node, 2 node and 4 node configurations. For all of our tests there is an increase in DB load at the beginning of tests. We think that this is due to cache misses. For some operations there is no much difference whether it is running a 1 node or 4 node environment because they are usually simple and most of the time caching working good. For more complex operations or where we don't have caches and we need to calculate something effect of more nodes is visible such as processing of JQL queries. We can't speed up some JQL functions with Lucene because values returned by these JQL functions may change independent of issue state as explained in technical review part. jmeter_login_and_view_dashboard is build-in login operation that comes with performance test framework but I think it is also a heavy weight operation and this is why it is effected by node increase very well.
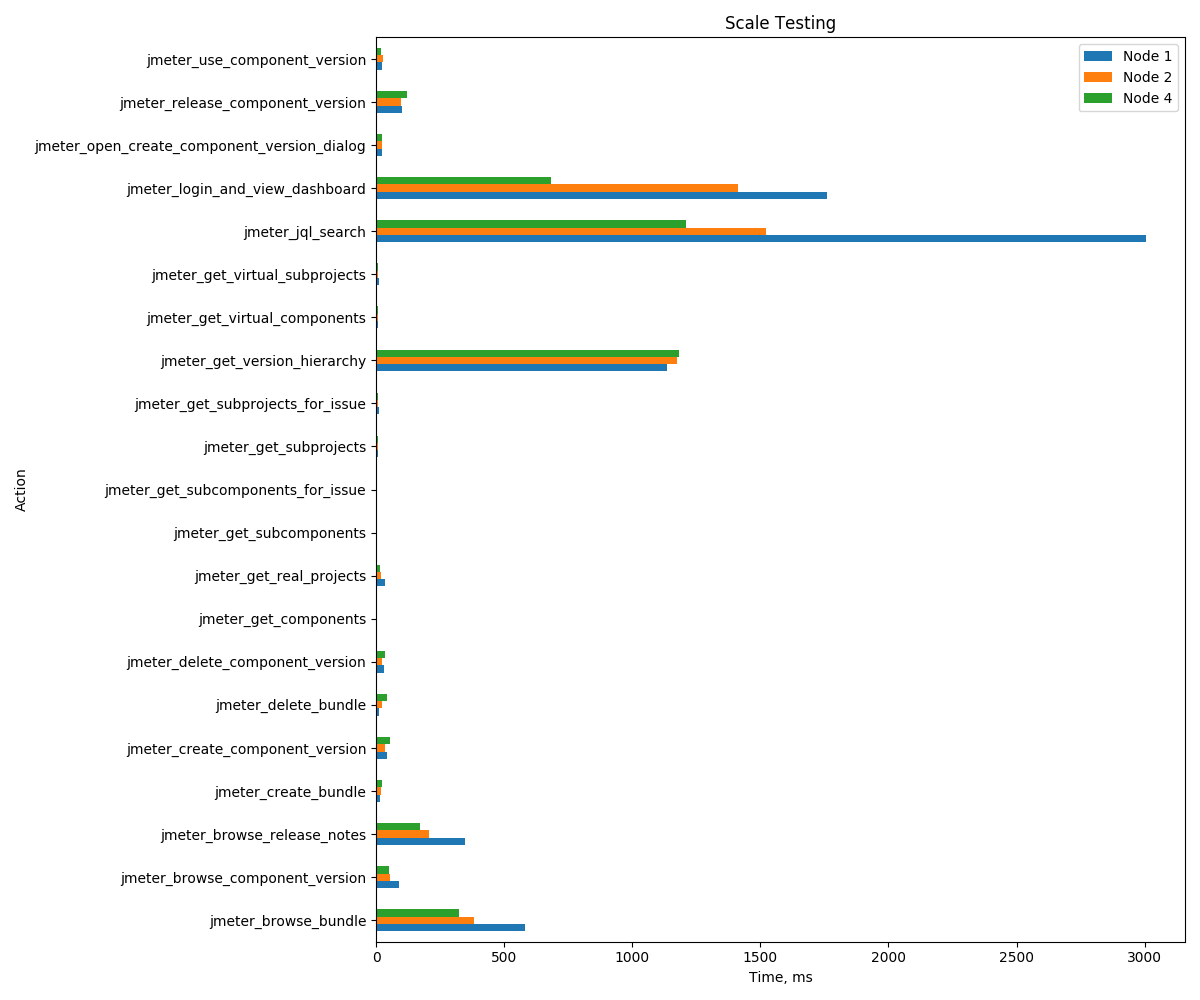
Action | 1 Node | 2 Nodes | 4 Nodes |
|---|---|---|---|
jmeter_login_and_view_dashboard | 1761 | 1411 | 683 |
jmeter_use_component_version | 25 | 26 | 18 |
jmeter_browse_component_version | 91 | 55 | 49 |
jmeter_get_subcomponents_for_issue | 5 | 5 | 5 |
jmeter_open_create_component_version_dialog | 23 | 24 | 24 |
jmeter_create_component_version | 43 | 36 | 53 |
jmeter_release_component_version | 102 | 96 | 121 |
jmeter_delete_component_version | 32 | 24 | 34 |
jmeter_browse_bundle | 583 | 382 | 324 |
jmeter_get_subprojects_for_issue | 11 | 9 | 9 |
jmeter_get_virtual_components | 8 | 8 | 8 |
jmeter_get_components | 5 | 5 | 4 |
jmeter_get_subcomponents | 4 | 4 | 4 |
jmeter_create_bundle | 14 | 20 | 25 |
jmeter_delete_bundle | 11 | 25 | 44 |
jmeter_jql_search | 3007 | 1523 | 1209 |
jmeter_get_virtual_subprojects | 10 | 6 | 6 |
jmeter_get_real_projects | 36 | 18 | 14 |
jmeter_get_subprojects | 7 | 6 | 6 |
jmeter_browse_release_notes | 346 | 208 | 171 |
jmeter_get_version_hierarchy | 1136 | 1175 | 1182 |
Indexing Time
Below indexing measurements are performed on c5.4xlarge instances on single node dc cluster installed using AWS quick start. A little increase in indexing time is normal because we have 3 custom fields active as explained in "Dataset" section. Scope of these fields are set to all projects. We have added caching and database indexes to speed up indexing of custom fields. In our test environment our Database and Jira node works on the same physical hardware in that case indexing time was nearly identical (37 minutes something).
Without App
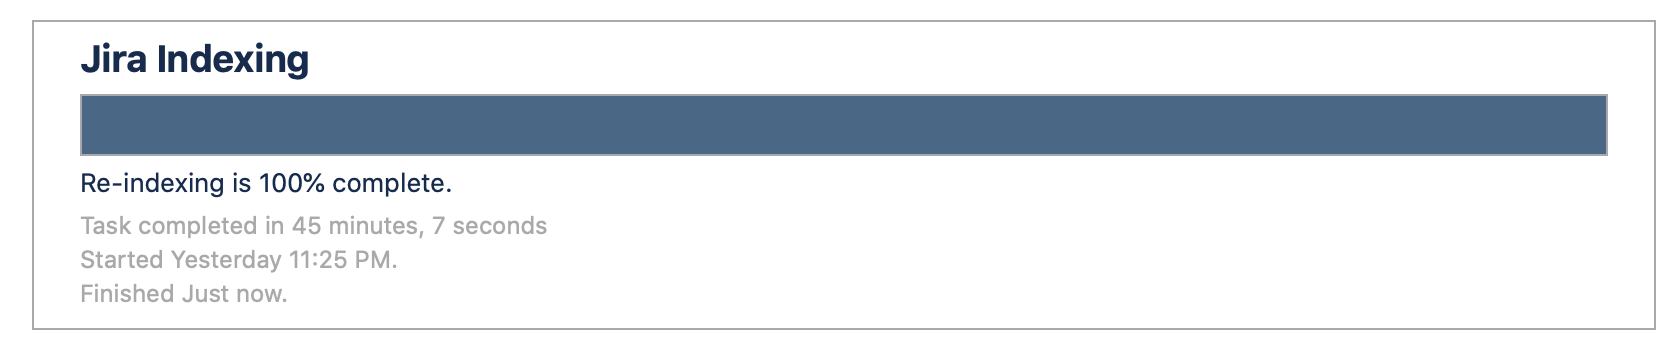
With App